Months of planning, phone conferences with Jens and Pedro, long emails between time zones – and then all of a sudden it´s there: Pentaho Community Meeting! Today, its 10th edition starts where it once began in 2008: in Mainz at the beautiful Kupferbergterrassen. I am extremly excited to welcome so many different people from around the world and I am proud that my team and me at it-novum organize it!
Pentaho Community Meeting starts with „Hacks&Snacks“. That is a hackaton for the developers (mostly from Portugal), tech talks for the geeks and food for the hungry. And a little name badge mess in the beginning. Then Pedro Alves and Jens Bleuel took over and announced the hackaton. To speak with Pedro words the hackaton is about „everything people wanna do“. Well, those who didn´t know what to received a data set of Trump tweets. Sounds like fun….
As we have received so many applications for conference day, we decided to introduce short tech talks along with hackaton on Friday night. Pranav Lakhani, Business Analyst at SPEC INDIA, is doing the first talk.
Self-Service Dashboards in Pentaho
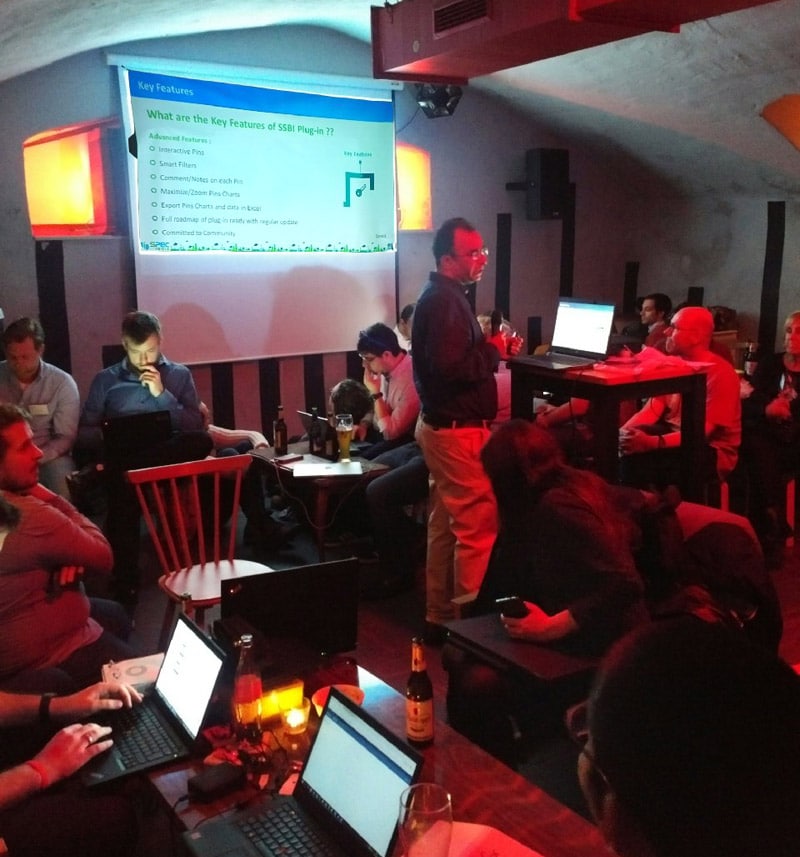
Pranav introduces SSBI, a plugin for self-service dashboards in Pentaho. With the plugin, business users can build very easily intuitive dashboards by selecting dimensions and measures with just a few clicks. This means they don´t rely anymore on their IT department but can start with building dashboards when they need them.
The motivation to develop this plugin came from users of the ZooM framework (Sales Force Automation) and VTS (Vehicle Tracking System). Mainly business users, they requested an interactive dashboard builder to build data visualizations without their IT depatments. Along with that, SPEC INDIA wanted to achieve a higher ROI on existing chart libraries like the ones in Pentaho.
- SSBI extends Pentaho Community version with many features:
- Robust architecture
- Multi-tenant
- Responsive design
- Easy and interactive user interface
- Support of multiple charts library – fusion charts, high charts, echarts and also CCC components.
- Supports multiple data layer. Flexy cube (SPEC component), CDA, Saiku CE
Users benefit from:
- better use of Pentaho community platform
- less time needed for developing interactive dashboards
- more flexibility for business users to create their own data visualizations
- a quick and interactive UI that fastens business decisions
- a higher ROI on existing EE charts library if license has already been purchased
Using data visualizations across the Pentaho platform
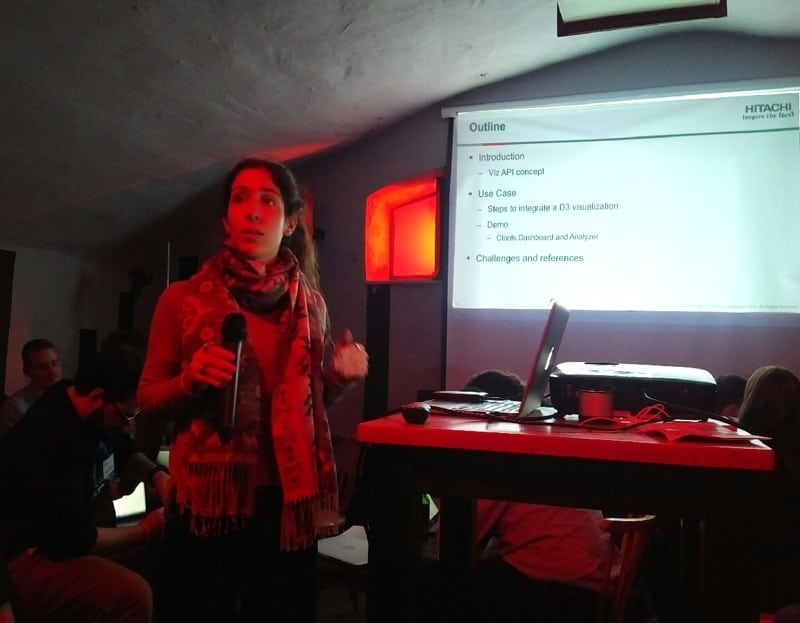
Joana from Pentaho presented a groundbreaking development for using data visualizations across the Pentaho platform. Until now, users couldn´t use the same custom visualization in different Pentaho tools: when they wanted to use a custom visualization they had created in CTools in Analyzer they had to adapt it for Pentaho Analyzer and couldn´t use it in Pentaho Data Integration.
Viz API 3.0 integrates different visualizations in the Pentaho platform unifying data visualizations across Analyzer, PDI and CTools. Using Viz Api 3.0, you can easily include D3 visualizations in a CTools dashboards. Moreover, adding these visualizatiosn through the Viz API will make them available in Analyzer and PDI enabling you to graphically analyze your data. Joana presented an example on how Viz Api 3.0 provides a fast and effortless way to provide custom visualizations to different parts of the Pentaho stack.
SVG images in Pentaho

João Barbosa from Pentaho introduced the new SVG component for CDE (Ctools). The idea behind it is to use SVG images to create specific visualizations on CTools dashboards (those that do not fit into the regular tables, charts and KPIs that we are used to). For doing it, beyond installed it from Pentaho Marketplace, one should create/find a pretty SVG image, one that suits the vizualition purpose, find where the data is and create a custom datasource to feed the component (more information can be found in the componenet example).
Deploying Pentaho using Puppet

There is a high demand by DevOps and System administrators for solutions intending to integrate, automate and deploy a new Pentaho server. The presentation “Deploying Pentaho server using puppet” showed how to use a new puppet module to create an infrastructure capable to leverage on the Puppet software to implement strategies to delivery new customized installations. The module allows the administrators to create and manage different definitions based on the Pentaho version and the environment to be installed as well as leverage on a system of token replacement to create personalized configurations. More information about the Pentaho puppet module and how to use it can be found at PuppetForge.
The after-lunch Trump dump
Now it was time to let the different hackaton groups present their solutions:
-
- The first hackaton analyzed Trump’s tweets and actually found out that he most probably tweets when sitting on the toilet. Most tweets were sent at night and after 3pm so the group decided to call this pattern „the after-lunch trump dump“.
- The second group chose a freeky topic: they measured th alcohol level with a combination of different tools including a raspberry pi. They were even able to do predictive analytics: by a high chance people would not only get drunk but also wasted. For this, a totally arbitrary number was chosen – 18.
- Team „Blockchain Rockers“ was even creepier: to follow the motto „make Donald tweet again!“ they created a little program that generates tweets via click.
- The fourth team analyzed the tweets Trump tweeted before and after his election. For example, they found out that the most retweeted tweet after his election was the one with a video showing him beating up a guy.
- Analyzing the most important keywords in Trumps’s tweets was the topic that the group from London chose. Unfortunately, I didn´t understand which keywords ranked the highest 🙂
- Not surprisingly, the team with the most useless and absurd result won: the „Trumpregator“. Congratulations and who wants to know more about how it works, here is Nicolai’s blog.